WEEK 4: LIFE TRACKING & DATA VISUALIZATION ACTIVITY
- Evon Liew

- May 16, 2020
- 1 min read
Updated: May 22, 2020
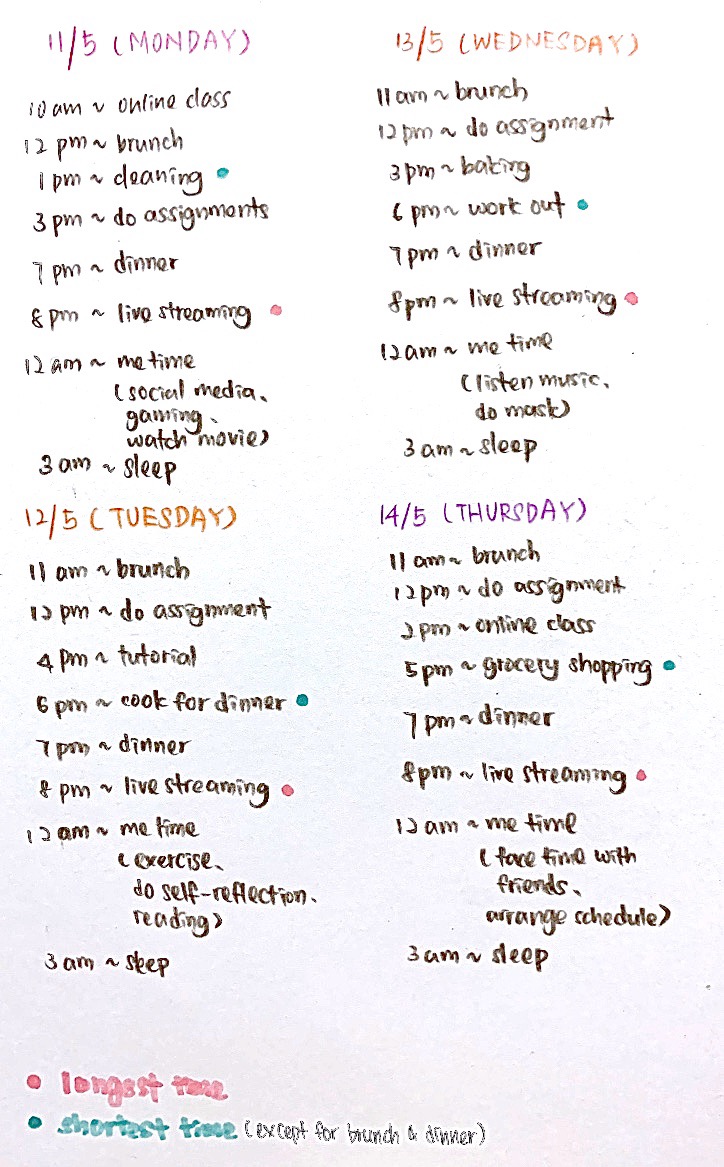
This activity is to observe and track. It’s given some examples that we can determine ourselves. From 11/5 to 14/5, I’ve recorded what I did at every time, because I wanted to know what and which activity that I spend most of the time on. I found it was interesting to write down after I’ve done my activity, and sometimes I felt a bit guilty by wasting too much of time on a particular work. So, it was a good way to develop the habit of self-reflection and I can allocate my time better.
This is the result of my analysis.


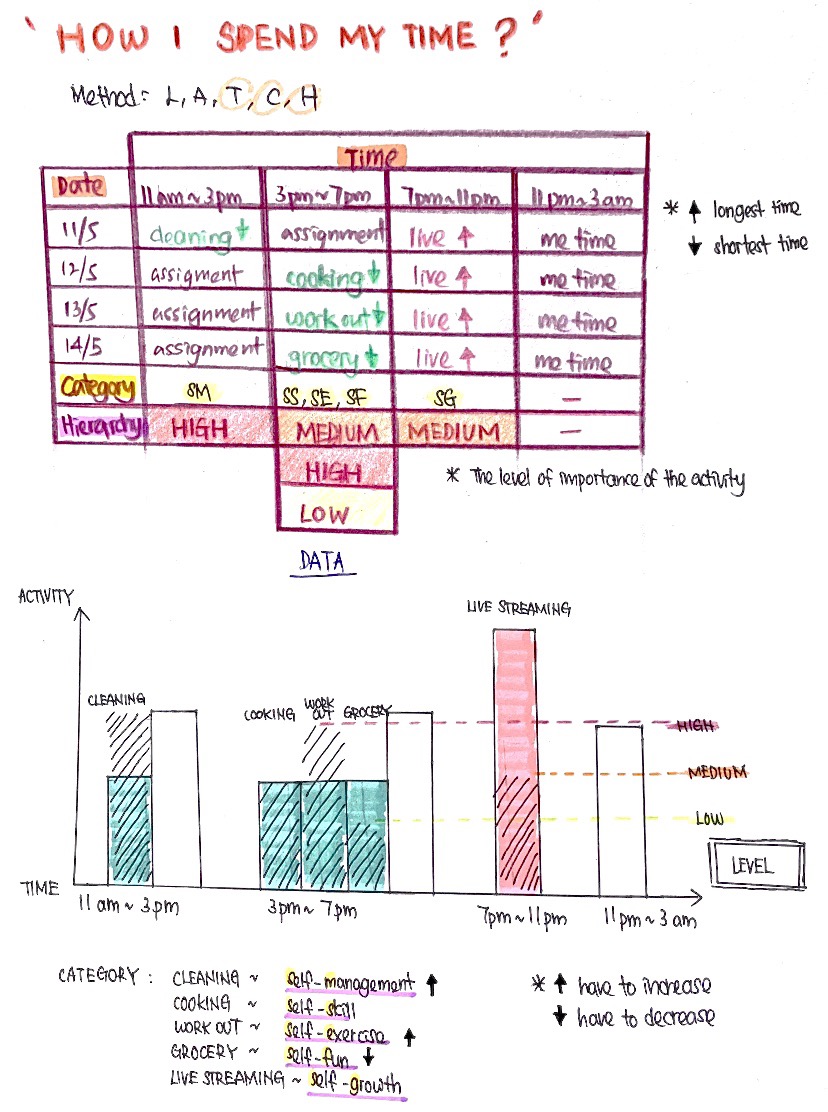
I used time, category & hierarchy to help me organize the data. Then, I summed up where I spend my time at. Later on, I have used charts to analyze which activities should increase time and which should decrease. And I make a bar chart to make my information more clearer.
I think I spend too much time on the live broadcast to strengthen my speaking ability and make friends. Also, I should increase the time to do cleaning work and exercise, because a hygienic environment and a healthy body only can improve my life.
In conclusion, I think everyone should learn to manage themselves and allocate time well, in this way we can lead a fulfilled life every day and do not regret because time is precious.

hahaha, that's mean the level of importance for the activity in my opinion
Hey Evon, interesting exercise!
One question tho, what does the "High" "Med" "Low" mean?