WEEK 3: REAL-TIME DATA VISUALISATION
- Evon Liew

- Nov 16, 2020
- 1 min read
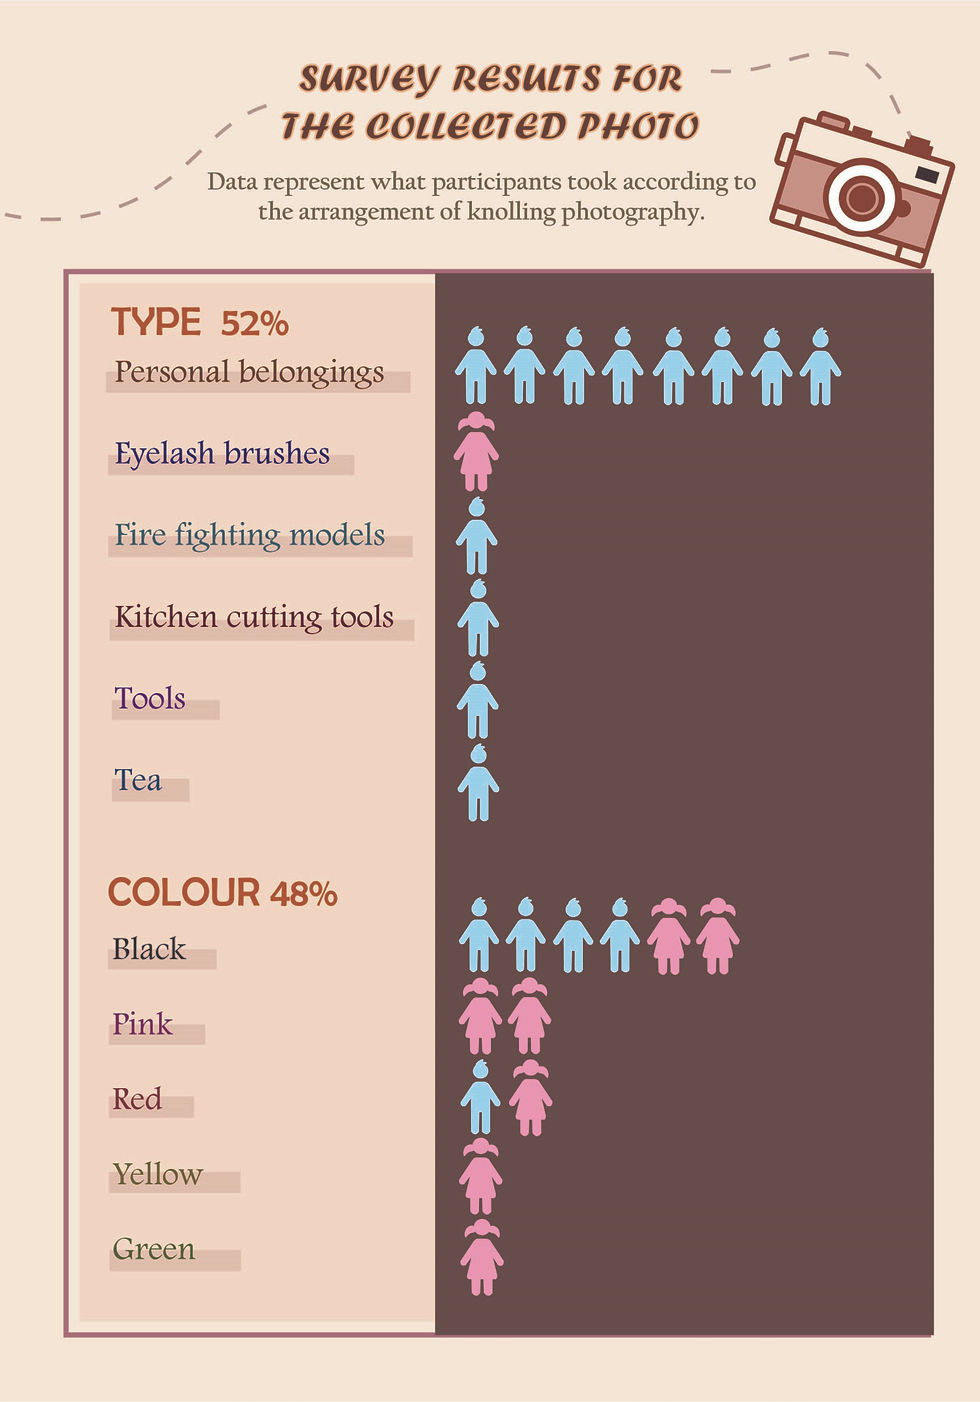
From the last tutorial, lecturer mentioned that the questionnaire made is acceptable, but I must take a step forward and think about the visual effect of the final data. So, I have researched on it and got an inspiration of real-time visualization that presented in a company. The data behind these visualizations is continually updated, thereby becoming a real-time representation.


Comments